A residential battery may be charging and discharging every day, yet a homeowner can still have little idea whether those energy flows match the way the household actually consumes electricity. A battery percentage alone cannot explain why stored energy is being used, whether solar production is being consumed effectively, or when household demand tends to rise.
Energy-use data fills that gap. By showing current conditions alongside historical patterns and broader energy insights, an energy management software platform can help users understand the relationship between generation, consumption and storage. The value is not simply seeing more numbers; it is using those numbers to make more informed decisions about how the battery is operated.
A Battery Cannot Be Judged by Its Charge Level Alone
Looking at a battery’s state of charge provides only one part of the picture. Knowing that a battery is, for example, partially charged does not reveal what caused that level or what the household’s electricity demand looked like while the battery was charging.
A useful monitoring view needs to connect storage with the wider energy system. Production, consumption and battery activity become more meaningful when they can be considered together rather than as isolated readings.
That context matters because residential electricity use is rarely constant. Cooking, heating, cooling, appliances and other activities can create different demand patterns throughout the day. Solar production also changes over time, creating periods when surplus electricity may be available for storage and periods when household demand relies more heavily on stored energy.
Fox ESS positions FoxCloud 2.0 as a platform for monitoring and controlling home energy usage, while also tracking detailed production and consumption.
Real-Time Data Shows What Is Happening Now
Real-time information is most useful when a homeowner wants to understand the system’s current operating situation. Instead of guessing whether electricity is coming from solar generation, the battery or another source, users can observe the energy dynamics through the monitoring platform.
That immediate visibility can reveal relationships that are difficult to recognize from an electricity bill. A homeowner might notice that household demand has increased while solar production has fallen, or see that stored energy is being used during a particular period of consumption.
An energy management software solution can make this information easier to interpret by bringing different aspects of household energy activity into one interface. FoxCloud 2.0 describes its app as providing monitoring and control of home energy usage, along with detailed production and consumption information.
The practical benefit is awareness. Users can compare what they expected the system to be doing with what the system is actually doing at a particular moment.
Historical Trends Reveal the Household’s Energy Rhythm
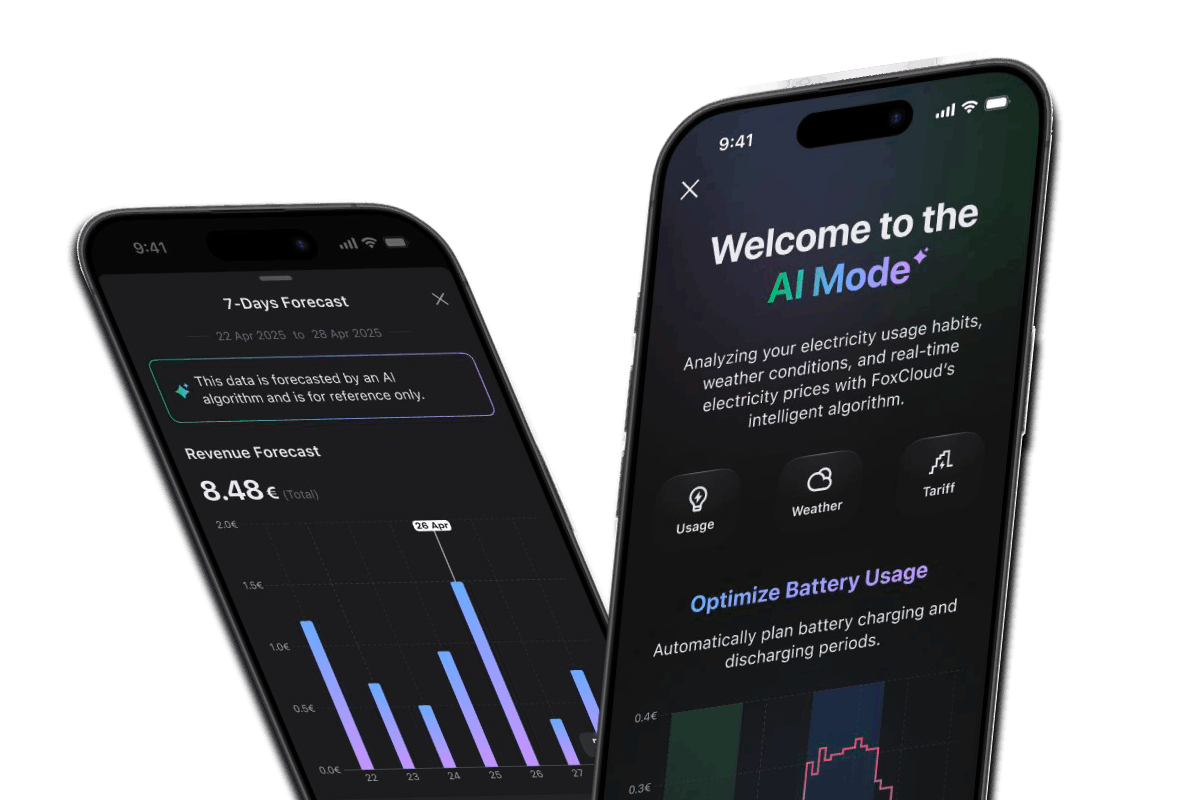
One day’s data can explain an event, while repeated data can reveal a pattern. Historical views are therefore important for understanding residential battery behavior over longer periods, and FoxCloud 2.0 provides energy trends that can be viewed by day, week, month, or year, allowing users to examine changes in production and consumption across different time scales.
This can help distinguish an unusual day from a recurring household pattern. A temporary increase in consumption may require no change in behavior, while a repeated evening demand peak could indicate a consistent opportunity to make better use of stored solar energy.
Seasonal differences can also become easier to recognize. Solar production and household electricity requirements may not follow the same pattern throughout the year. Historical information gives users a reference point for interpreting those changes instead of relying on assumptions based on a single day’s operation.
Energy Insights Turn Patterns Into Better Decisions
Data becomes more valuable when it helps answer practical questions. When does household consumption usually increase? How does energy production compare with demand? Are changes in usage temporary or recurring? Does the observed pattern justify changing how the system is operated?
FoxCloud 2.0 describes its “Smart Insights” function as providing information on energy production and consumption and enabling users to view trends over different periods. The platform also presents energy-use information intended to support future energy decisions.
That distinction is important. The purpose of energy insights is not simply to produce a larger dashboard. Users need understandable information that helps them interpret their own energy behavior.
For example, historical consumption data may show that substantial household demand regularly occurs after solar production declines. Such a pattern can prompt a homeowner to examine whether more of the available solar energy could be retained in the battery earlier in the day.
Charging and Discharging Should Be Read as a Cycle
Charging and discharging make sense only when considered together with the household’s energy rhythm. A battery charges because energy is available and discharges because energy is needed or because the system is operating according to a particular energy strategy.
Data allows users to observe those movements instead of treating charging and discharging as separate events. A daytime period can be examined alongside solar production and household consumption, while evening behavior can be compared with the amount of energy retained in storage.
FoxCloud 2.0 also provides tariff-related functions, including Smart Tariff and manually configured tariff plans. The platform states that users can configure tariff plans and select time modes, providing another source of information for understanding how energy use relates to electricity pricing.
Such visibility does not mean that every household should follow the same charging schedule. Actual decisions depend on the home’s consumption, generation, tariff structure and system configuration. The data instead gives users a factual basis for evaluating their own circumstances.
The Value of Data Is Measured by What Users Learn
An effective energy management software solution should make household energy behavior easier to understand, not merely display technical information. Real-time data explains what is happening now. Historical trends show whether that behavior is typical. Energy insights help users connect those observations with future decisions.
For residential batteries, that sequence is particularly useful because storage sits between generation and consumption. Understanding only the battery’s charge level leaves out the conditions that created it.
The Fox ESS FoxCloud 2.0 platform brings production, consumption, system monitoring and energy insights into a single environment, while its battery portfolio provides the storage component that users can observe through the system.
